
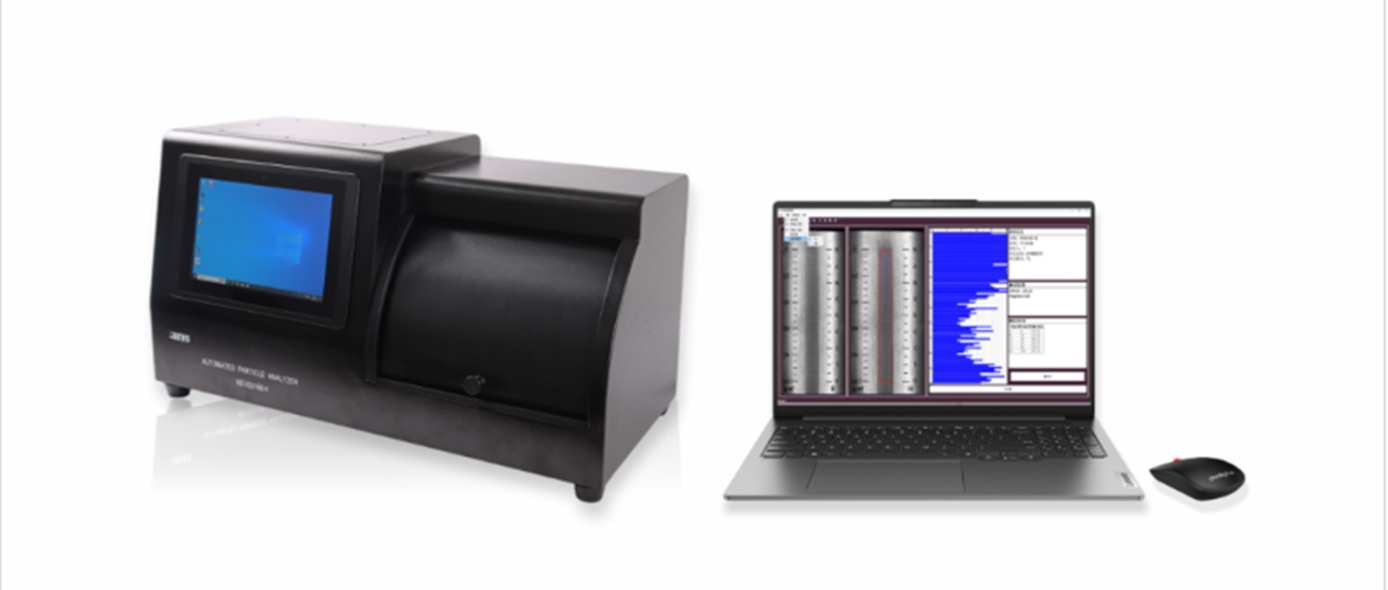
Newly Upgraded
It is universally acknowledged that the determination of fineness of grind of paints is crucial for quality control. Colorful coatings are most commonly used for testing, while transparent and translucent coatings are usually not, due to their own characteristics.
Transparent or translucent coatings have high transparency, so light is not easily scattered or reflected when propagating inside them, making it very difficult to observe the particle details. The optical properties of transparent coatings make it difficult for us to accurately measure its fineness value using the ordinary scraper method.
Recently, BEVS lab conducted a test to determine the fineness of transparent resin slurry with BEVS 3168H Automated Particle Analyzer. The following information is the details of this test.

Instruments
Automated Particle Analyzer

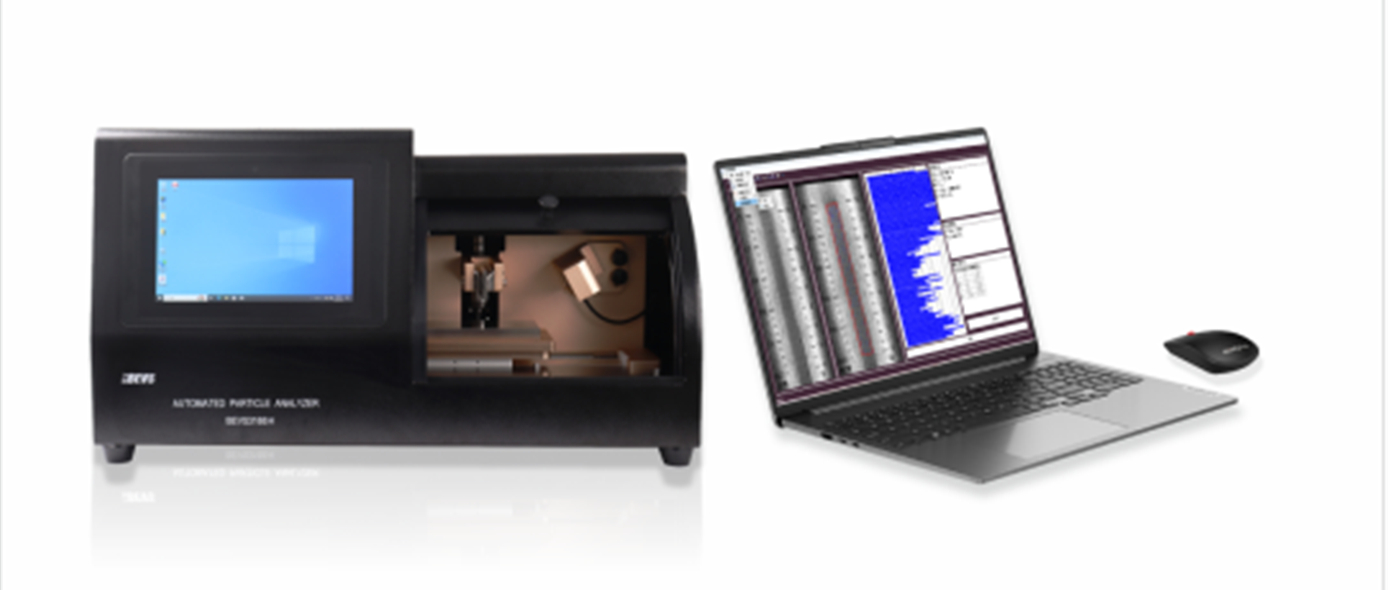
1. Model:BEVS 3168H
2. Measurement range:0~200μm
3. Resolution:1μm
4. Accuracy:± (readings×2% +3)μm
5. Cycle measurement time: 30s
Single Channel Grind Gauge

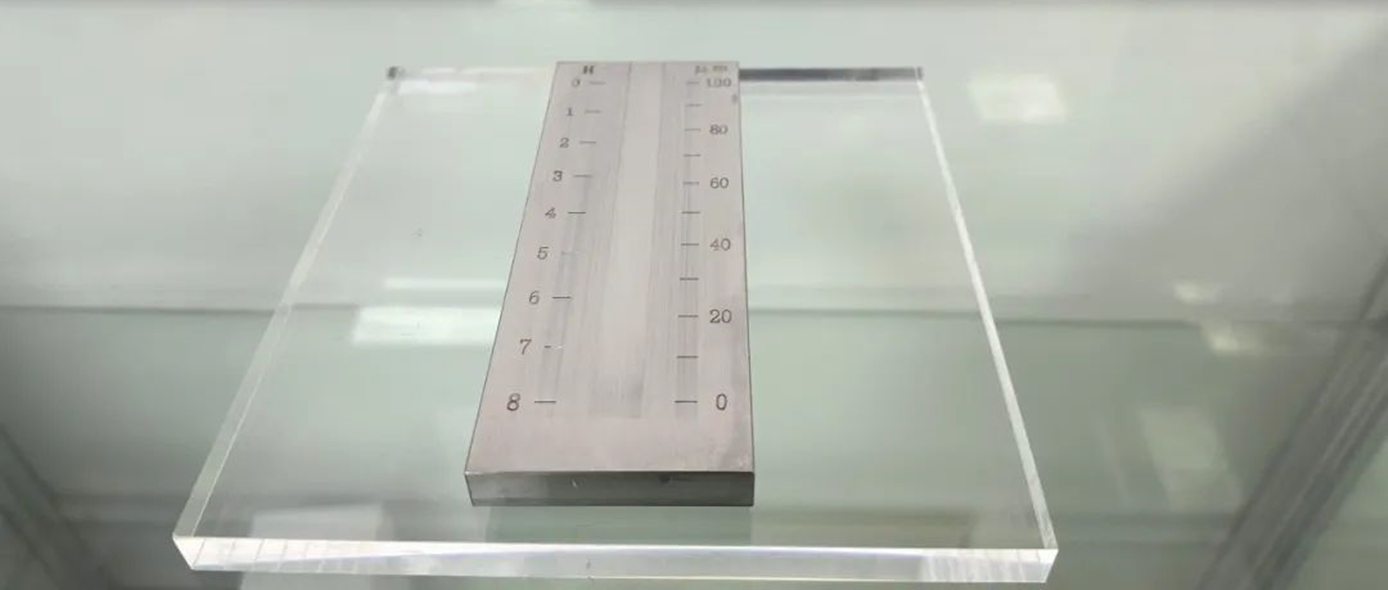
1. Model: BEVS 1903/100
2. Measurement range: 0~100μm
3. Division value: 10μm
4. Unit: μm, H
5. Channel: 1

Sample
Resin slurry

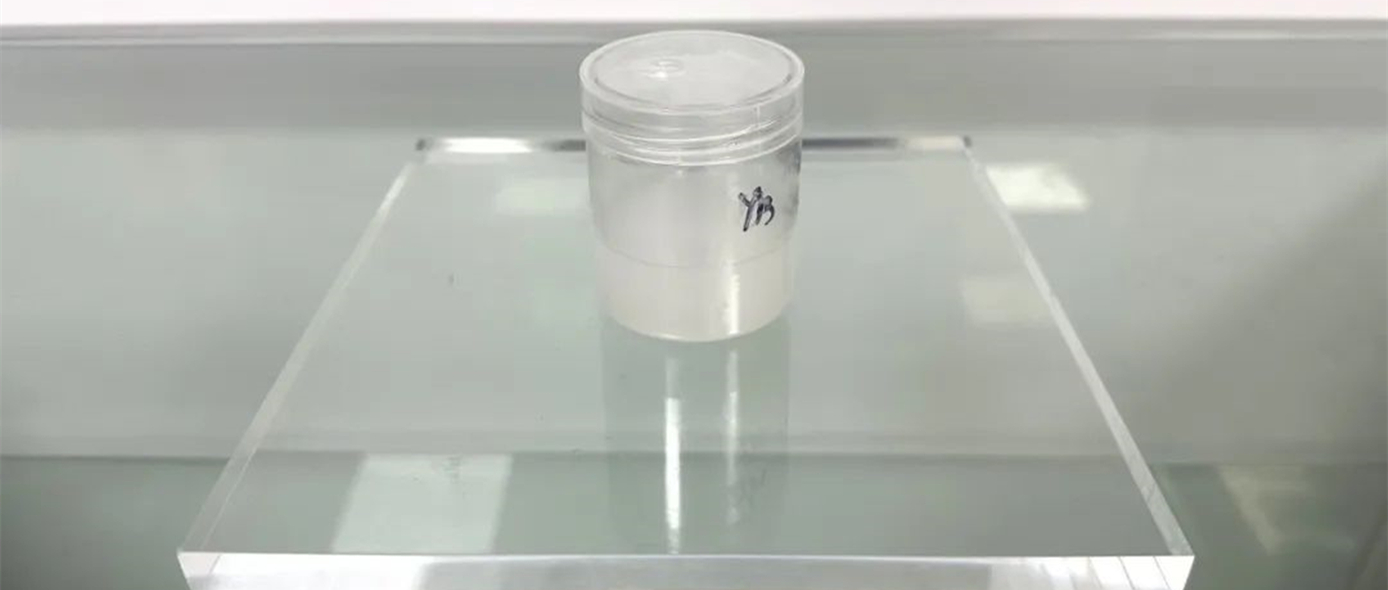
Sample name.: Y13D851B
Color: Milky white
Appearance: Translucent thick liquid

Procedure
Place the Single Channel Grind Gauge on the testing platform of the analyzer.
A small amount of sample is poured into the deep end of the Single Channel Grind Gauge with a pipette.
Slide the cover and then click 'Start Measurement', automatically start the test.
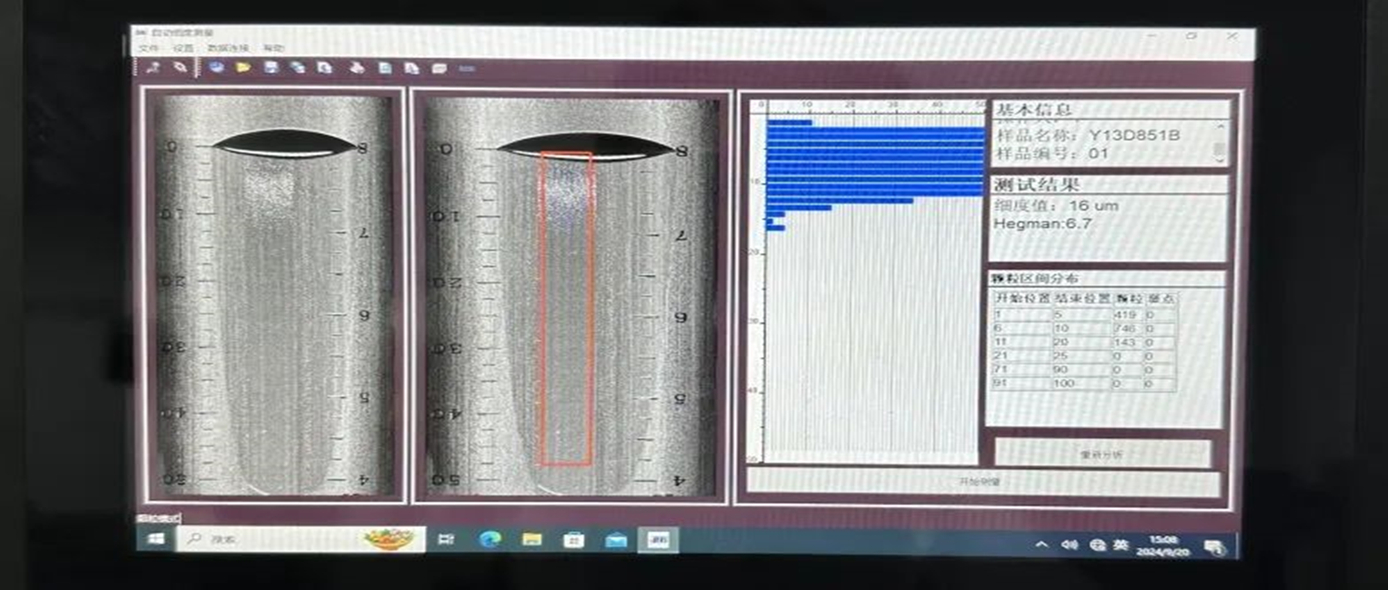
Single measurement only takes about several seconds. Test results will be displayed on the screen and can be output via a USB port.
On the screen, there are two photos of the grind gauge on the left captured during the test. One is the original photo and the other with a red frame line is the photo analyzed by data processing and algorithms. The size and distribution of particles are marked with blue dots on the photo with a red frame.
On the right are parameters of the testing results, including the particle size distribution histogram, the number of particles and others. At the same time, you can find theparticle zise: 16μm (H:6.7).
After the reading, slide the cover to take out the single channel and scraper, and clean them immediately with a clean dust-free cloth and alcohol.
To ensure the accuracy of the results, the whole process should be repeated at least three times, and the difference between two readings should not be greater than ± (16 x 2% + 3) μm, i.e. 3 μm.

Conclusion
Difficulties of manual measurement
Firstly, it is very difficult for normal people to recognize the significant position and quantity of particles in the wet film in a short time with the naked eye.
Secondly, the precision and accuracy of the manual scraper method are easily affected by the scraper angle and the uniformity of the force applied by both hands, resulting in operator variance and user error.
Solutions
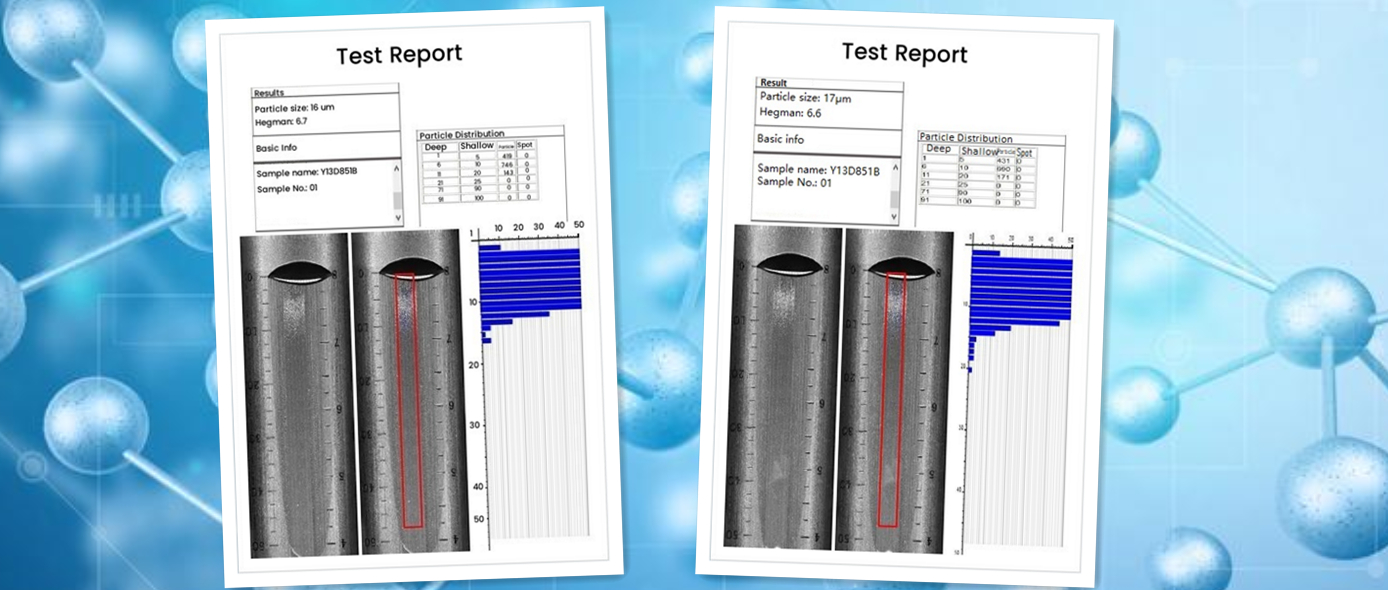
With the intelligent analysis system, the test results report is output to the computer for data comparison. Form our test, we can find that testing results of sample Y13D851B are 16 μm (H:6.7) and 17 μm (H:6.6) accordingly, with a difference of only 1 μm, which demonstrates the accuracy of the test.
This benefits from the visual imaging, artificial intelligence and big data technology used by BEVS 3168H Automatic Particle Analyzer. 4K high-definition camera can scan the entire image in just 3 seconds. Then the advanced data processing and algorithms analyze the image to provide results of fineness quickly with reliable data.
Besides, the entire testing process is completed in a relatively closed test room, which greatly reduces the impact of environmental factors such as dust on the test results.


